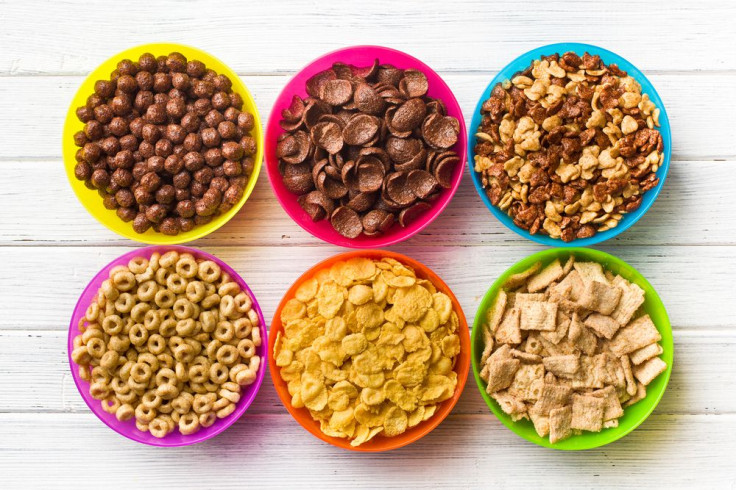
Breakfast Cereals Marketed Toward Children Contain 40% More Sugar Compared To Cereal For Adults

Health experts recommend a nutritious breakfast to sustain energy throughout the day and prevent overeating during the meals that lie ahead. However, a breakfast loaded with sugar, fat, and unhealthy calories does just the opposite and increases a person’s risk of diabetes, cardiovascular disease, and obesity. The Environmental Working Group (EWG) issued a report on Thursday revealing that breakfast cereal marketed for children contains an average of 40 percent more sugar than adult cereal.
Back in 2011, EWG researchers analyzed the nutritional facts behind 84 children’s cereal to see which brands matched up with the World Health Organization's recommendation of no more than 10 percent of calories from added sugar. On average, the research team found, children’s cereal was made up of 29 percent sugar. The biggest offender, Kellogg’s Honey Smacks, contained 15 grams of sugar per serving.
The recent report from the EWG analyzed 181 children’s cereals, including the 84 that were featured in the original report. In 2014, the average children’s cereal is still made up of 20 percent sugar even though some companies have reformulated their recipe to include less sugar. Ten of the cereals that were able to lower their sugar content only did so by one gram.
“When you exclude obviously sugar-heavy foods like candy, cookies, ice cream, soft and fruit drinks, breakfast cereals are the single greatest source of added sugars in the diets of children under the age of eight,” nutritionist and EWG consultant Dawn Undurraga, co-author of the organization’s new report, Children’s Cereals: Sugar by the Pound, said in a statement. “Cereals that pack in as much sugar as junk food should not be considered part of a healthy breakfast or diet. Kids already eat two to three times the amount of sugar experts recommend.”
The EWG’s 10 Worst Children’s Cereals:
1. Kellogg’s Honey Smacks
Grams of sugar per serving (2011) - 15
Grams of sugar per serving (2014) - 15
2. Post Golden Crisp
Grams of sugar per serving (2011) - 14
Grams of sugar per serving (2014) - 14
3. Kellogg’s Froot Loops Marshmellow
Grams of sugar per serving (2011) - 14
Grams of sugar per serving (2014) - 14
4. Quaker Oats Cap’n Crunch’s OOPS! All Berries
Grams of sugar per serving (2011) - 15
Grams of sugar per serving (2014 - 15
5. Quaker Oats Cap’n Crunch Original
Grams of sugar per serving (2011) - 12
Grams of sugar per serving (2014) - 12
6. Quaker Oats OH!s
Grams of sugar per serving (2011) - 12
Grams of sugar per serving (2014) - 12
7. Kellogg’s Smorz
Grams of sugar per serving (2011) - 13
Grams of sugar per serving (2014) - 13
8. Kellogg’s Apple Jacks
Grams of sugar per serving (2011) - 12
Grams of sugar per serving (2014) - 12
9. Quaker Oats Cap’n Crunch’s Crunch Berries
Grams of sugar per serving (2011) - 11
Grams of sugar per serving (2014) - 11
10. Kellogg’s Froot Loops Original
Grams of sugar per serving (2011) - 12
Grams of sugar per serving (2014) - 12


